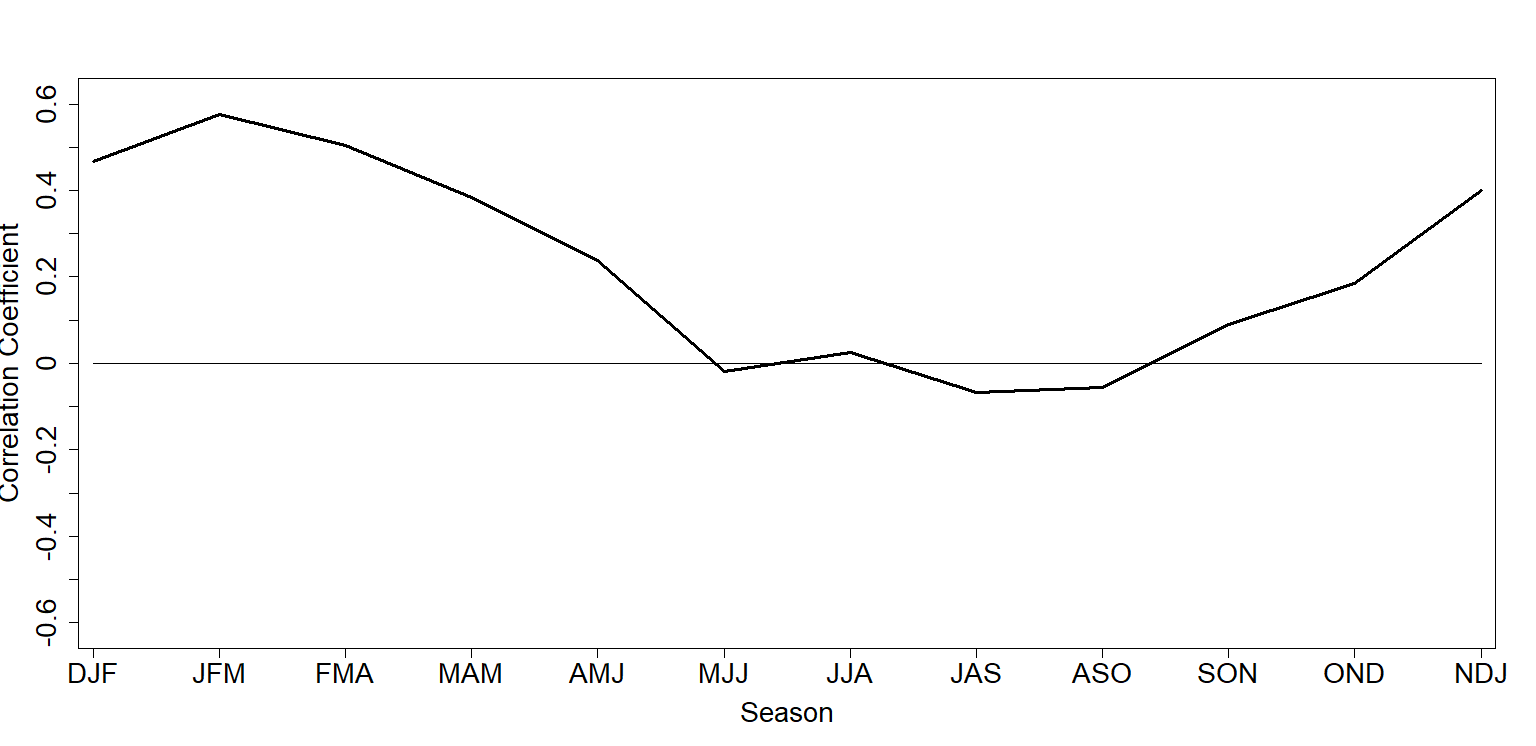
As shown by Schulte et al. (2017), the ENA pattern is
related to eastern equatorial Pacific SST anomalies during the winter and
spring. Temporal changes in extreme eastern equatorial Pacific SST anomalies can be
measured
using the NINO 1+2 index. Schulte et al. (2017) showed that the
relationship between the ENA and Nino 1+2 indices is
strongest in the January-March and February-April
seasons. Consistently, the Marches and Februaries following the super strong 1982-1983,
1997-1998, and 2015-2016 EL Ninos featured positive ENA phases. In fact, a prominent
positive ENA event- perhaps the strongest event on record based on daily NCEP reanalysis-
occurred in February 2016. This event featured widespread
severe weather across the
eastern United States. The Northeast U.S was also quite wet in February 2016
(https://www.ncdc.noaa.gov/sotc/national/201602),
consistent with how the February ENA index is positively correlated with February
precipitation anomalies
across the
Northeast U.S as shown
here.
